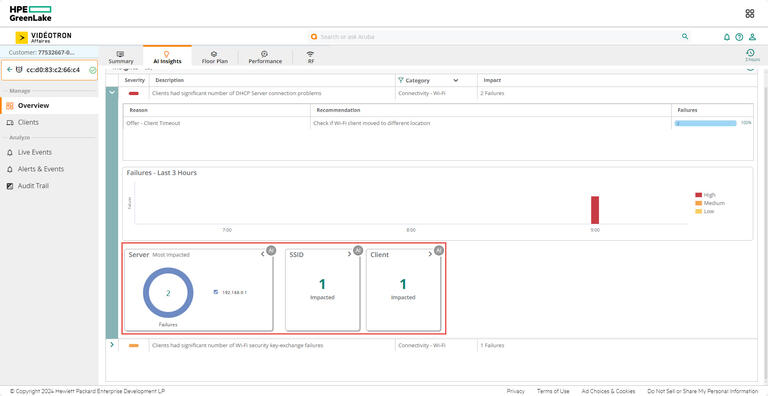
Global card view
Each card typically shows the most impacted data in a pie chart or a bar graph view.
The data in a pie chart can be modified based on your requirements. To highlight specific entries in a card, click on the check box next to each label.
Few cards have a more details option. If more information is available, it will be displayed as a drop-down list to the right of the selected card’s name.
For more information, we invite you to watch the demo video available on the HPE Aruba portal by clicking on the following link : Cards (arubanetworks.com)
Information presented in the cards
The cards for each insight may vary based on context.
The following list presents the cards available in different AI insights. To access more information or a graphic representation, if available, click on the arrow, followed by the drop-down menu.
Access Point: The Access Point card displays the number of APs impacted by an insight.
Channel : The Channel card displays the number of channel changes per channel for a specific access point in the network.
Client : The Client card displays the number of clients impacted by an insight.
Central Processing Unit (CPU) : The CPU card is available at the device (gateways and switches) context and displays the number of gateways and switches impacted by high CPU utilization in the network.
Gateway : The Gateway card displays the number of gateways impacted by an insight.
Memory : The Memory card is available at the device (gateways and switches) context and displays the number of gateways and switches impacted by high memory utilization in the network.
Outdoor Clients : The Outdoor Clients card is available only for Outdoor Clients Impacting Wi-Fi Performance insight. It displays the percentage of avoided outdoor client minutes.
Outdoor Minutes : The Outdoor Minutes card is available only for the Outdoor Clients Impacting Wi-Fi Performance insight. It displays the percentage of avoided outdoor client minutes and affected indoor client minutes.
Port : The Port card is available for the switch port health insights. It displays the number of ports experiencing excessive flaps or errors.
Power : The Power card displays the number of power changes in access points in the network.
Radio Frequency (RF) Info : The RF Info card displays the number of channels, band, and SSID information based on the insight it is accessed from.
Roam : The Roam card displays the percentage of client latency roams.
Server : The Server card displays the number of servers impacted by an insight.
Site : The Site card displays the number of sites impacted by an insight.
Switch : The Switch card displays the number of switches impacted by an insight.
Tunnel : The Tunnel card displays the number of gateway tunnels that are down.
VPNC : The VPNC card displays the number of VPNC gateways on which the tunnels are down.
Wired clients : The Wired Clients card displays the number of wired clients impacted by an insight.


