AI Insights is an advanced feature of our Wi-Fi Pro service that helps identify anomalies observed in the Aruba Central network that could affect the quality of the overall network performance and the steps to help resolve these issues.
How does the AI Insights dashboard work?
The AI Insights dashboard displays a report of network events that could possibly affect the quality of the overall network performance. These are anomalies observed at the access point, connectivity, and client level for the selected time range. Each insight provides specific details on the occurrences of these events for easy debugging.
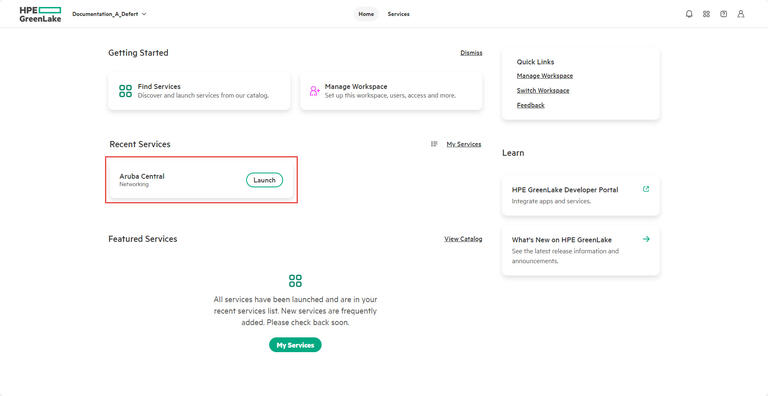
1- Access the Aruba Central portal and launch the app.
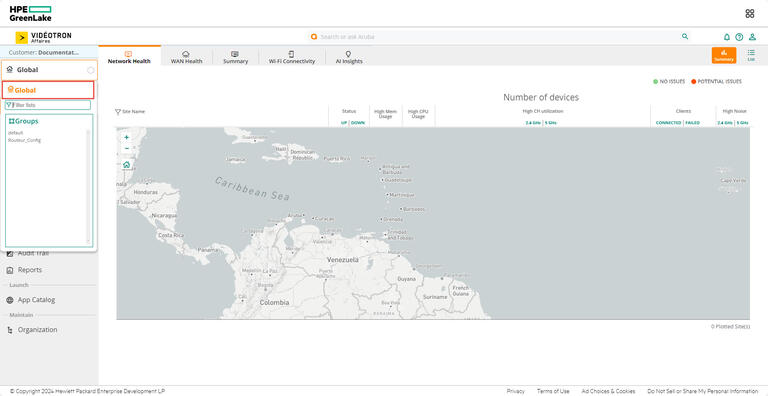
2- In the Aruba Central app, set the view filter to Global, not the devices group.
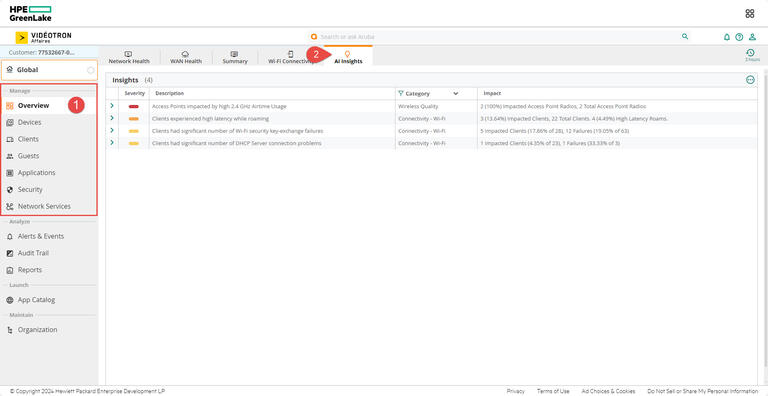
3- Select Overview in the Manage section on the left and go to the AI Insights tab once on the page.
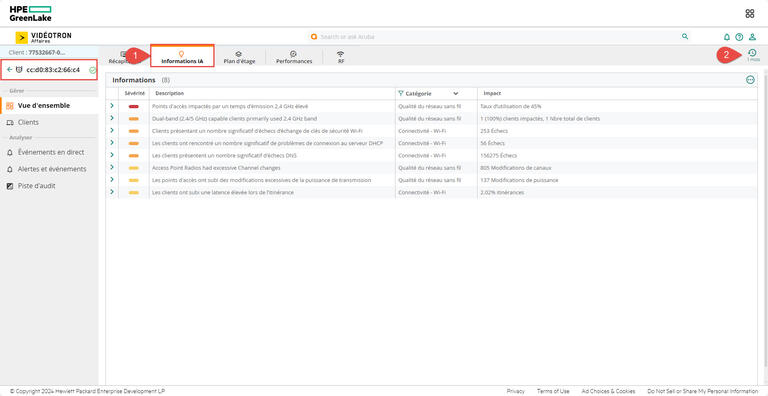
4- The AI Insights dashboard provides information about the status of your network, as well as provide configuration recommendations. The anomalies listed in the dashboard are ranked in order of importance, from high priority to low priority.
Severity : The following colors are used to display the severity of anomalies or recommendations in the severity column:
- Red: High priority
- Orange: Medium priority
- Yellow : Low priority
- Blue : Configuration recommendation
Description : Provides a brief explanation of the identified anomaly or recommendation.
Categories : The AI Insights dashboard classifies insights under the following categories:
- Connectivity: Issues related to the wireless connectivity in the network
- Wireless Quality: Issues related to the Radio Frequency (RF) Info or RF Health in the network.
- Availability: Issues related to the health of your network infrastructure and the devices in the network, such as access points, switches, and gateways.
You can filter anomalies by category by clicking on the filter icon at the top left of the column.
Impact : Provides a brief explanation of the impact of the identified anomaly or recommendation on your operations.
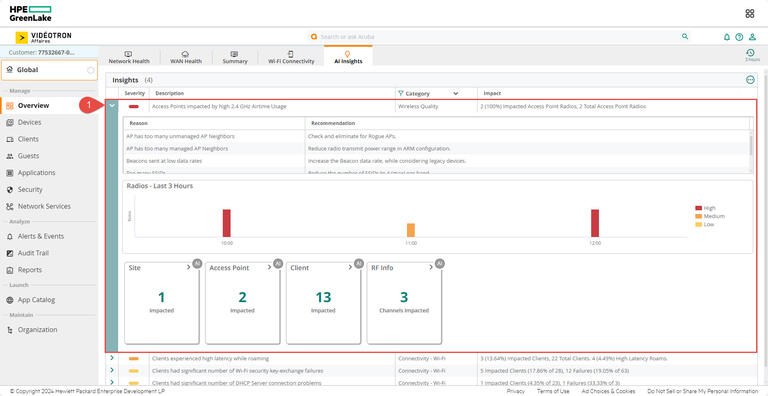
5- If you want more information about anomalies and recommendations, you can click on the arrow to the left of each row to expand a specific overview and view additional details.
Summary: Insight Summary displays the reason why the insight was generated along with the recommendation. It also shows the number and percentage of failures that occurred against each failure reason. The reasons are classified by:
- Static: These reasons rely on Aruba's domain expertise.
- Dynamic: These reasons are generated based on error codes that are received from infrastructure devices.
Time Series graph: Is a graphical representation of the failure percentage or failure events that occurred for the selected time range. The entries in each time series bar can be customized to highlight a specific entry by clicking on it. Only one specific entry can be highlighted at a time.
Cards: Cards display additional information specific to each insight. Cards might vary for each insight based on the context the insight is accessed from.
Good to know
How to access AI Insights by access point?
In the Access Point dashboard, the AI Insights tab displays information about AP performance issues, such as excessive channel changes, excessive reboots, airtime usage, and memory usage.
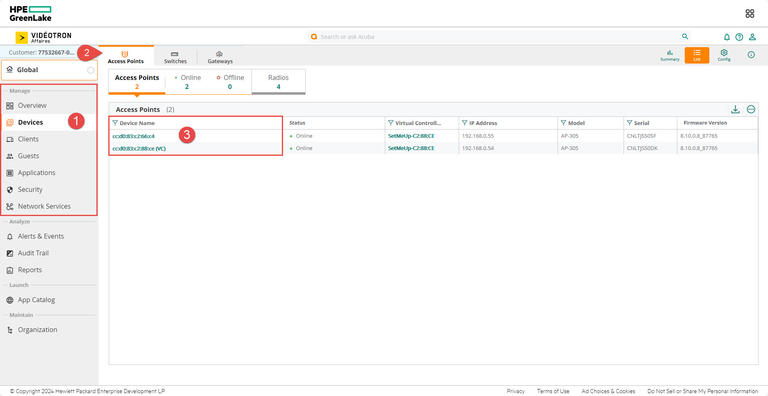
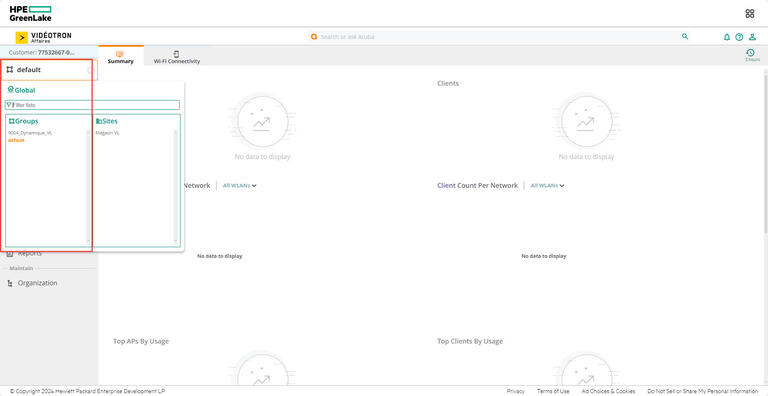
1- Once in the Aruba Central app, set the filter to one of the options under Group, Label, or Site to choose access points assigned to one of these categories. Be sure to select a filter that contains at least one active access point. For all your devices, choose the global view.
2- In the Manage section on the left, select Devices. Once on the page, make sure you are in the Access Points tab. The page shows your access points in List view. Select the access point you want to get information about by clicking on its name in the Device Name column.
3- Once the access point dashboard is displayed, go to the AI Insights tab to view information and recommendations related to the chosen access point, if any.
You can change the time range for the AI Info tab by clicking on the time range filter and selecting one of the available options: 3 hours, 1 day, 1 week, 1 month, or 3 months.
To exit the access point dashboard, click on the filter’s back arrow next to the access point’s name.
How to access AI Insights by switch?
In the Switch dashboard, the AI Insights tab displays information on switch performance issues such as PoE (Power over Ethernet) issues, port errors, port flaps, airtime utilization, and memory utilization.
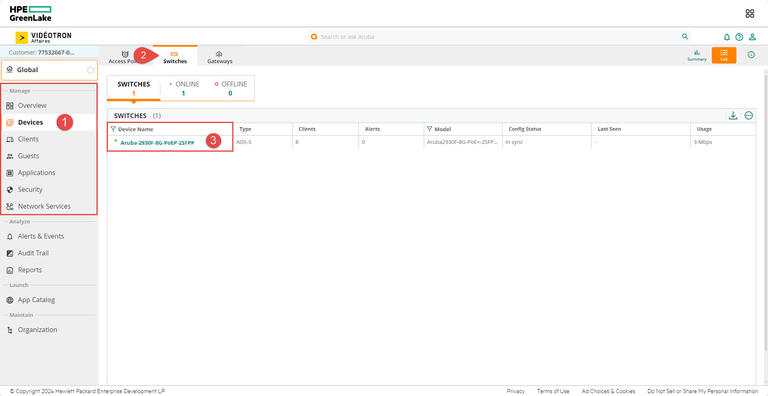
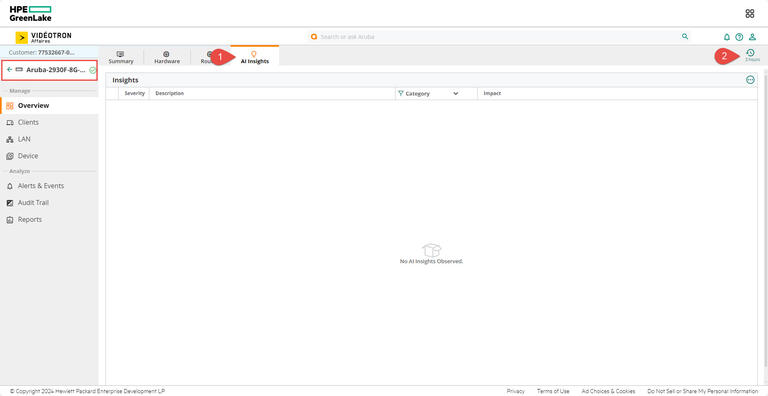
1- Once in the Aruba Central app, set the filter to one of the options under Group, Label, or Site to choose switches assigned to one of these categories. Make sure that the selected filter contains at least one active switch.
For all your devices, choose the global view.
2- In the Manage section on the left, select Devices. Once you're on the page, make sure you're in the Switches tab. The page shows your switches in List view. Select the switch you want to get information about by clicking on its name in the Device Name column.
3- Once the switch dashboard is displayed, go to the AI Insights tab to view information and recommendations related to the chosen Switch, if any.
You can change the time range for the AI Insights tab by clicking the time range filter and selecting one of the available options: 3 hours, 1 day, 1 week, 1 month, and 3 months.
To exit the switch dashboard, click on the filter’s back arrow next to the switch’s name.
How to access AI Insights by gateway?
In the Gateway dashboard, the AI Insights tab displays information about gateway performance issues, such as tunnel-up, tunnel down, airtime or memory usage issues, and so on.
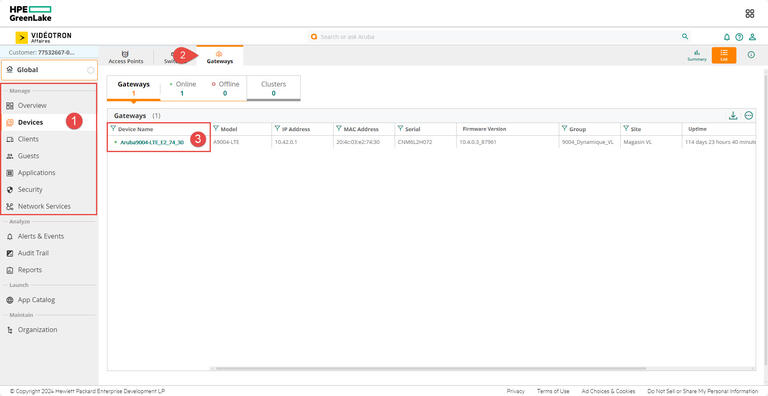
1- Once in the Aruba Central app, set the filter to one of the options under Group, Label, or Site to choose access points assigned to one of these categories. Make sure that the selected filter contains at least one active access point. For all your devices, choose the global view.
2- In the Manage section on the left, select Devices. Once you're on the page, make sure you're in the Gateway tab. The page shows your gateways in List view. Select the gateway you want to get information about by clicking on its name in the Device Name column.
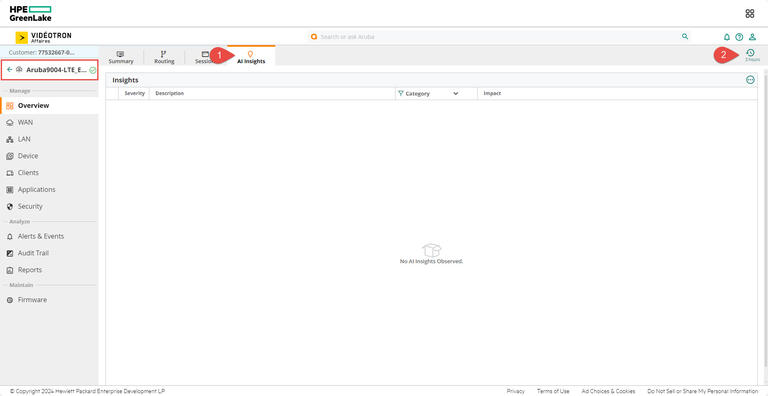
3- Once the gateway dashboard is displayed, go to the AI Insights tab to view information and recommendations related to the chosen access point, if any.
You can change the time range for the AI Insights tab by clicking the time range filter and selecting one of the available options: 3 hours, 1 day, 1 week, 1 month, and 3 months.
To exit the gateway dashboard, click on the filter’s back arrow next to the gateway’s name.
We are here to help
For general questions about your invoices or one of our products or services.
For assistance or to report a problem with a service or an equipment-related issue.
